
So, what I wanted to do with this blog post is a comparison between two different savings options you could use for your child—or any adult for that matter. I have done a YouTube video, and blog, about the various savings options and in my opinion the top two options for a child (and for most adults) is a High Yield Savings account (HYS) and a Properly Designed High Cash-Value Whole Life Policy with a major mutual company (or, as many call it, an ‘Infinite Banking’ or IBC policy), and the latter is FAR superior to the second best option, which is what I will be illustrating here.
First let me explain what I will be attempting to show here, and what I will not be attempting to show.
What I am NOT showing, or comparing, is different investment opportunities. I am strictly comparing two savings options. Comparing a savings option to an investment option would be comparing apples and oranges. But it is important to note that you may indeed want some portion of the capital you are accumulating for your child, or yourself, to be in investments that have a higher risk profile that may also prove to provide higher returns. But it is important to note that by practicing IBC, you can do both without hindering one or the other, you generally can’t do this with any other savings vehicle. So, if you want to put your capital into investment opportunities like Real Estate, or speculative opportunities like equities, option trading etc., you can still do so via an IBC policy—not so with a HYS account.
What I am going to be comparing here is the best two options for savings after considering things like liquidity, risk, taxes, rate of return etc. And specifically, focusing on the difference in actual realized growth between the two options, in one example without spending the saved capital and another with spending the saved capital, but using said capital only on consumption—ideally you would be buying cash flowing assets with said capital, but I wanted to show how this works even if only used for consumption and typical life events.
Assumptions Used
For the HYS account, I am assuming an average interest rate over this time frame of 2.5%. While current HYS rates as of Aug 2025 are between 3-4%, prior to a few years ago, HYS rates were all under 1% for a decade or more. I suspect interest rates will remain below current averages for the majority of this time frame due to various factors like massive budget deficits and expected rate cuts headings into a softening economy.
For the WL policy returns, these are copied from an actual illustration and assume that the current dividend is the same for the entire life of the policy. However, if interest rates continue to stay near where they are now, or increase, then the returns will be higher (dividends tend to lag interest rate increases and decreases).
Other assumptions:
- An annual $5,000 contribution at the start of each year
- Contributions start at age 1
- A 25% marginal tax rate
- A 5% policy loan interest rate
- A car purchase in year 16 for $15,000
- Student loan lump sum repayment in year 23 for $100,000
- A downpayment on a primary home in year 39 of $150,000
- Paying for a wedding for a daughter in year 60 at $75,000
- No costs are price-inflation adjusted
*The $ amount of these purchases doesn’t really matter, what matters is the principle being shown here.
** Also note that a child’s WL policy is always run with a ‘Standard’ health rating, but once the child becomes an adult the health rating can be improved if they go back through underrating, increasing the IRR even more so.
***I am also not even considering the other benefits of the WL policy, but these have a very real and significant value to them: Death Benefit, Long Term Care rider, Guaranteed Purchase Rider, etc.
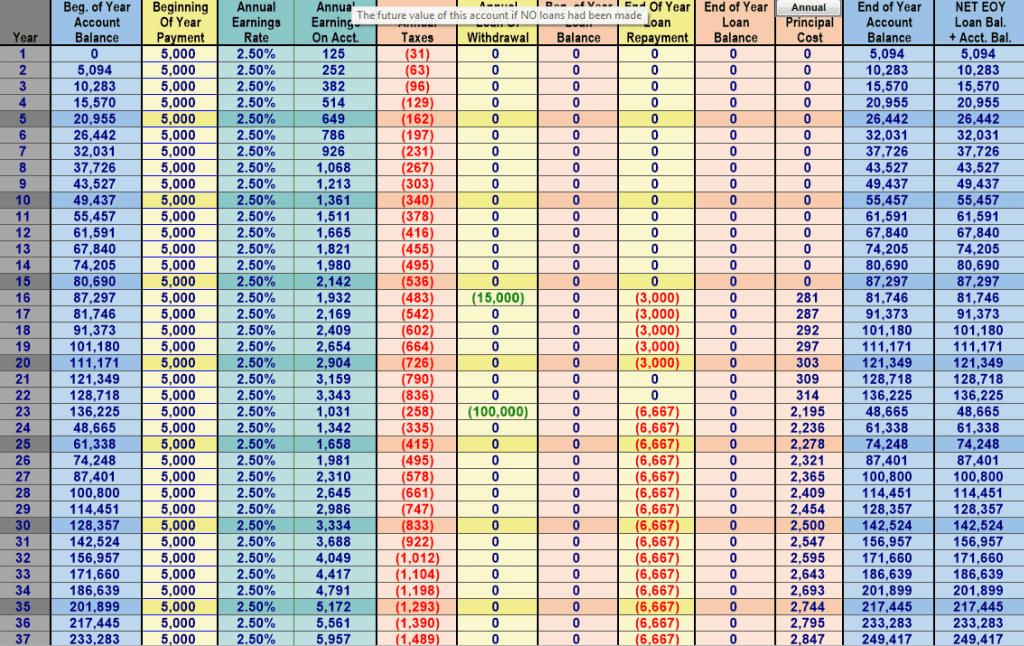
High Yield Savings Option – No Spending
Below you will see the breakdown of what a $5,000 contribution to a high yield savings account looks like, at the 25% tax bracket, assuming no withdrawal from the account ever occurred. An unrealistic assumption for sure, but we want to see what the potential of the account could be if we never interrupted the compounding.
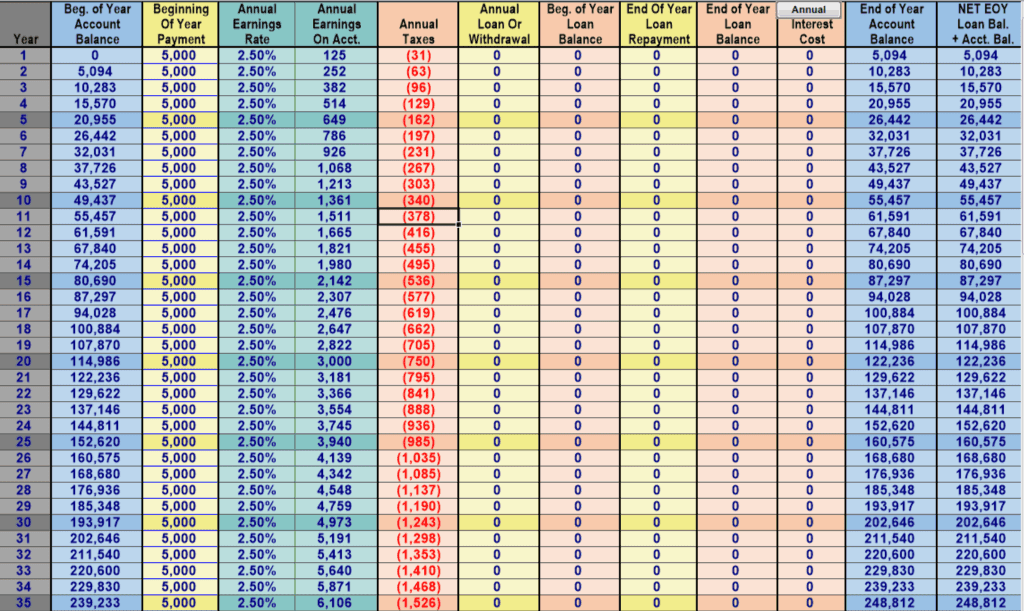
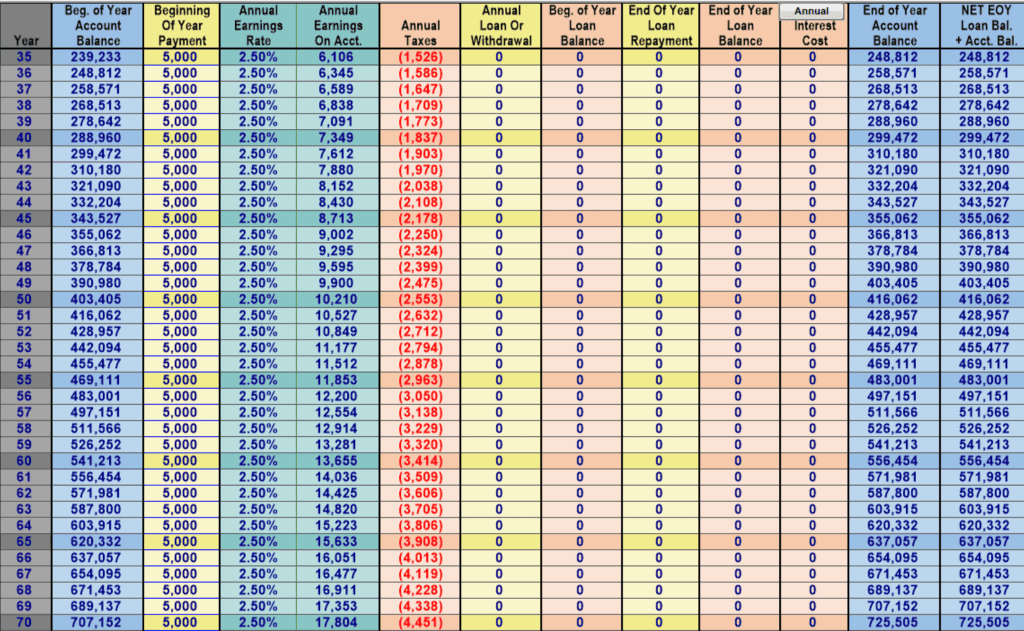
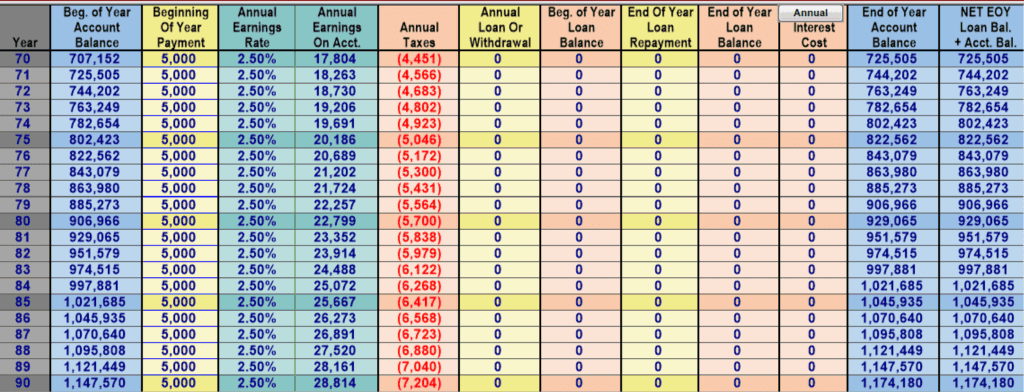
So, the breakdown of value by year is as follows (see chart above or year-by-year details):
Year 1: $5,094
Year 10: $55,457
Year 25: $160,575
Year 40: $299,472
Year 65: $637,057
Year 90: $1,174,180
This is our baseline, and would be the typical way someone would save, again assuming no consumption spending, or spending on investments.
Properly Designed Children’s Whole Life Policy – No Spending
Now below you will see the breakdown of what a $5,000 contribution to children’s WL policy looks like, assuming no withdrawal or policy loan from the account ever occurred. Again, an unrealistic assumption, but we want to compare the baseline between the two.
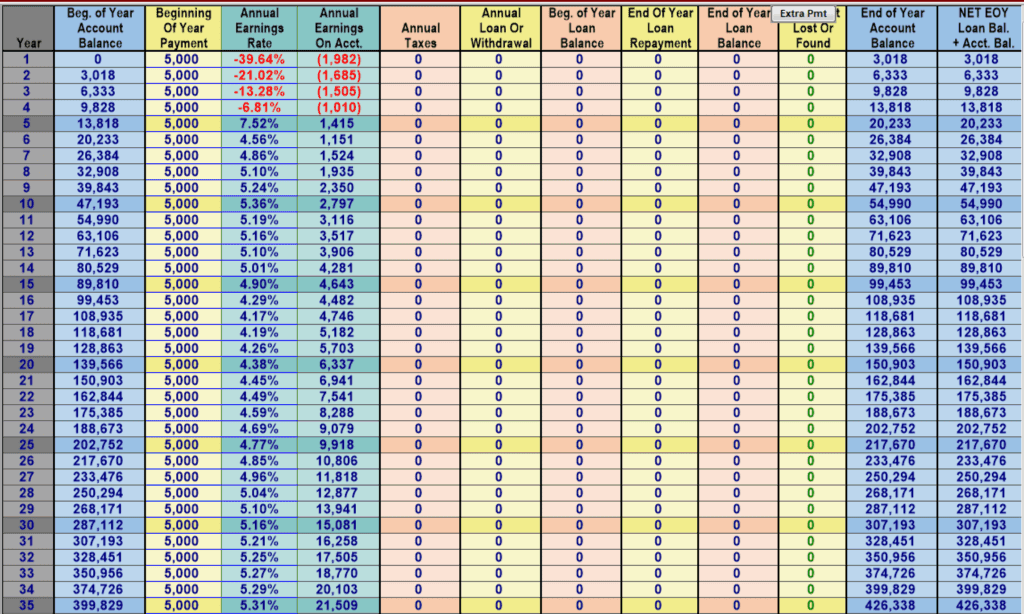
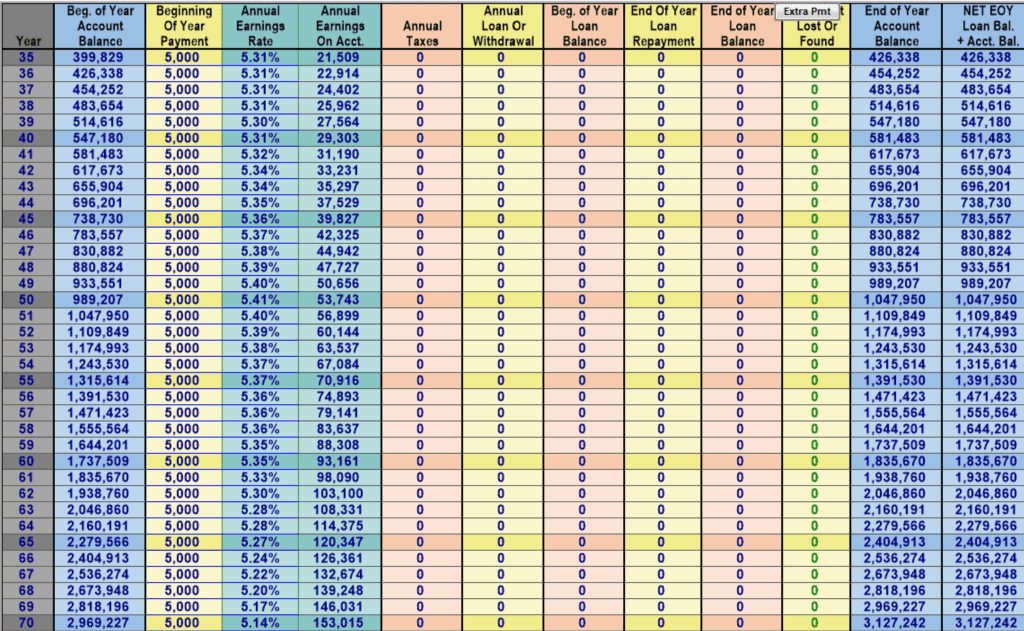
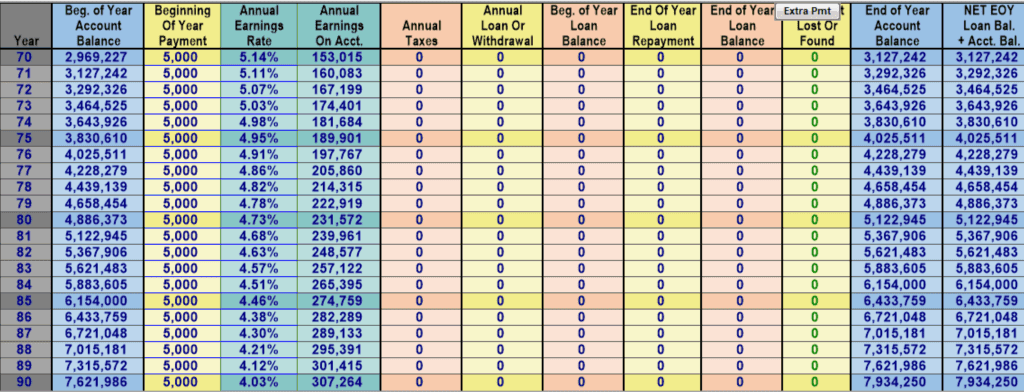
So, the breakdown of value by year is as follows (number in parentheses is the difference between the Savings comparison):
Year 1: $3,018 (-$2,076 -40.7%)
Year 10: $54,990 (-$467 -.8%)
Year 25: $217,670 (+$57,095 +35.5%)
Year 40: $581,483 (+$282,011 +94.1%)
Year 65: $2,404,913 (+$1,767,856 +277.5%)
Year 90: $7,934,250 (+$6,760,070 +575.7%)
So, you can see that in the short term, the HYS provides a higher return in the first 10 years, and then from year 11 on it begins to separate significantly. So right off the bat, we can see that the IBC route is better in the medium and long term, but worse in the short term. This is due to the policy expenses—administration, costs of insurance, commissions etc.—being front loaded, and thus, having to play catch-up those first 10 years.
The reason for this significant difference over the medium and long term in this example, is due to two factors: 1) the IRR of the policy cash value typically outperforms HYS (and bonds) and 2) The HYS is a taxable account, whereas the WL policy is tax free, if used properly (i.e. accessing cash via policy loans or withdrawals up to cost basis).
High Yield Savings Account – With Spending
Now we look at a more realistic case, where spending occurs from the savings account. For the spending assumption details refer to the assumptions at the beginning of the post. Also note that in year 39 they need to find an additional ~$25,000 to fund the home down-payment.
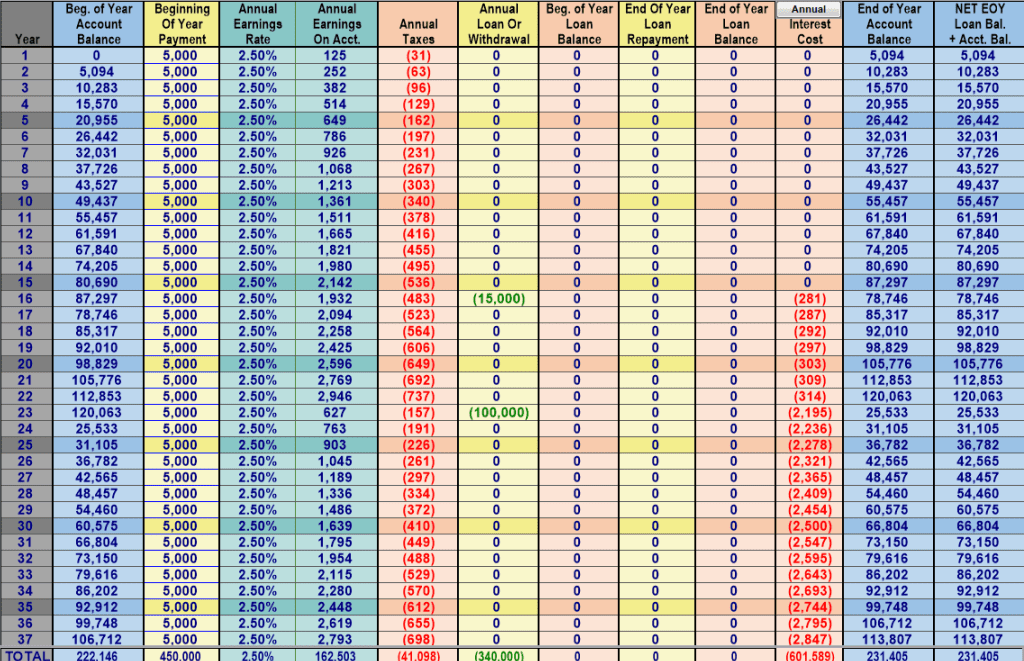
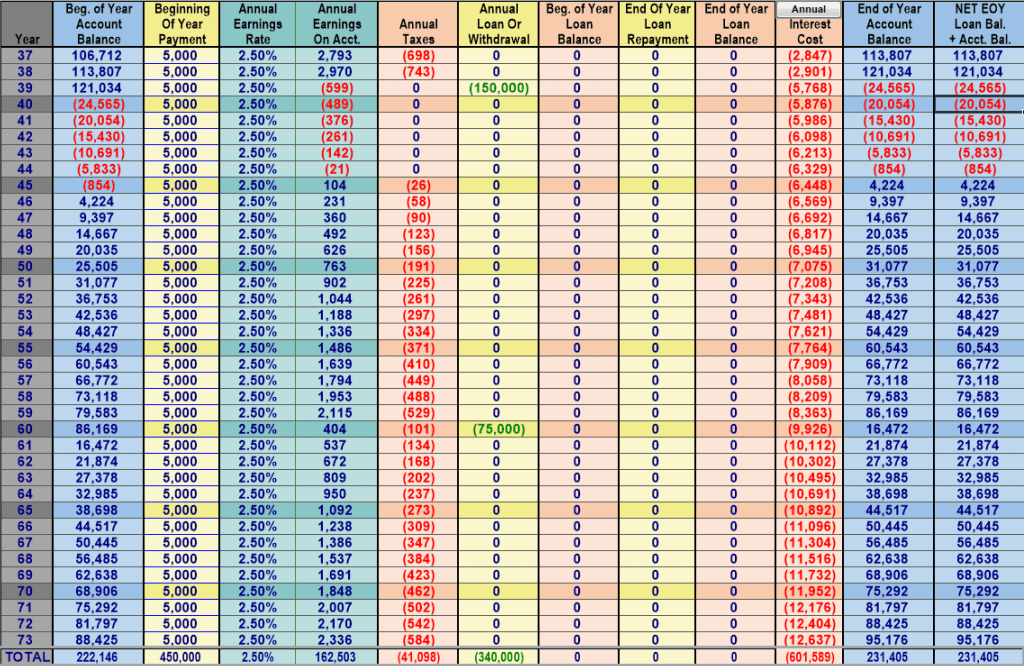
The number in parentheses is compared to the base HYS illustration, where no spending takes place.
Year 1: $5,094 (No Change)
Year 10: $55,457 (No Change)
Year 25: $36,782 (-$123,793)
Year 40: -$20,054 (-$319,526)
Year 65: $44,517 (-$592,540)
Year 90: $231,405 (-$942,775)
What you hopefully notice here is that the loss between the spending example and the baseline example with no spending is that the loss isn’t JUST the spending loss—the $15k for the car and $100k for college loans etc.—but there is an additional opportunity cost (OC). That opportunity cost was what the spending amount could have earned had it remained in the savings account.
So, by year 25 the additional opportunity cost is $8,793, for example (123,793-115,000=8,793). By year 40 the OC is $54,526. Year 65 $252,540, and year 90 $601,589. This means that your $340,000 of lifetime consumption spending actually cost you $942,775. (The column “Annual Interest Cost” shows you what the opportunity cost was in that given year for past spending, and in year 90 it shows you the total opportunity cost of all combined spending to that point).
Every time you spend money from your savings/checking, whether on consumption OR an investment, you are giving up the opportunity cost of those dollars FOREVER. Stop doing this and you can recapture thousands or millions of dollars over the course of your life.
Whole Life WITH repayment of loans
Now let’s compare the traditional savings route with the recommended IBC strategy. In this case we are taking policy loans from the insurance company and using our Cash Value as collateral, letting it continue to grow while we use the insurance company’s dollars and then pay them interest for the use of their capital. We then pay back the policy loan in a timely manner (loan repayment schedule is entirely up to the policy owner, so always play good banker to yourself).
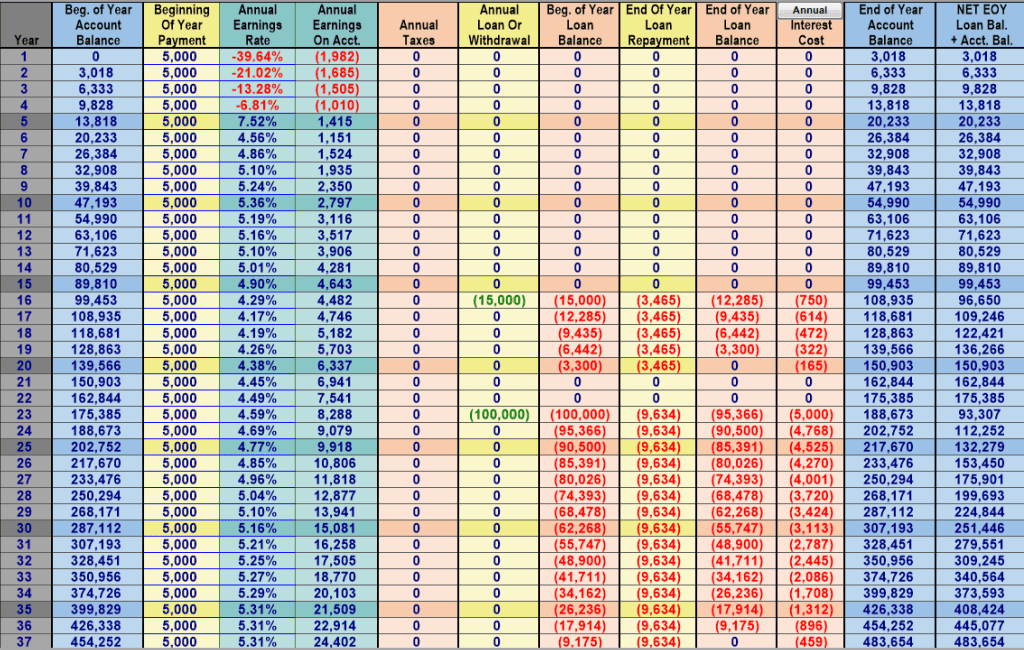

The parentheses will compare this strategy to the previous HYS with no payback example.
For the NET CV see the furthest column to the right on the above images, this is the NET EOY balance.
Year 1: $3,018 (-$2,076 -40.7%)
Year 10: $54,990 (-$467 -.8%)
Year 25: $132,279 (+$95,497 +259.6%)
Year 40: $440,783 (+$460,837 +NA/infinite)
Year 65: $2,404,913 (+$2,360,396 +5,302.2%)
Year 90: $7,934,250 (+$7,702,845 +3,328.7%)
Here we obviously see how much better using the properly designed WL policy is over the medium to long term when compared to a HYS. This is in part to the two reasons we mentioned earlier, but also since when we use policy loans to fund our consumption, we don’t interrupt the compound interest curve. This is because we are not taking money from our policy but rather using the CV as collateral for the policy loan. Thus, it grows even while we use it. We therefore do not experience the same high Opportunity Cost.
Now you may be saying, yeah but Tim, this isn’t an apples-to-apples comparison since in the IBC example you are paying the loans back over time. This is true. And I am showing this because it is indeed a more accurate comparison if we are looking at what people do in the real world. Almost no one who does the traditional route thinks they need to “pay back” their savings account, they assume a 0% cost of spending their cash, which is simply not the correct way to view it. The person who practices IBC and uses policy loans understands there is a cost to their savings, and so they create better habits through loan repayments to “pay themselves back”. So, while this is a much more accurate comparison, I will create a more exact apple-to-apple comparison with the next two examples.
So for this next example I will show the WL with loans, but with NO loan repayments. We are just letting the loans compound (which in the real world we would almost certainly never do except in specific situations that were planned for—like retirement, or a short term policy loan, less than a year, to fund say a RE flip etc.—and usually you would at least pay the interest on the loans so there was no compounding of the loan balance, which would make a significant difference on these numbers as the loan balance would remain flat).
WL with NO Loan repayments
Below we will compare the WL with loans but no loan repayments with the HYS with no repayments.
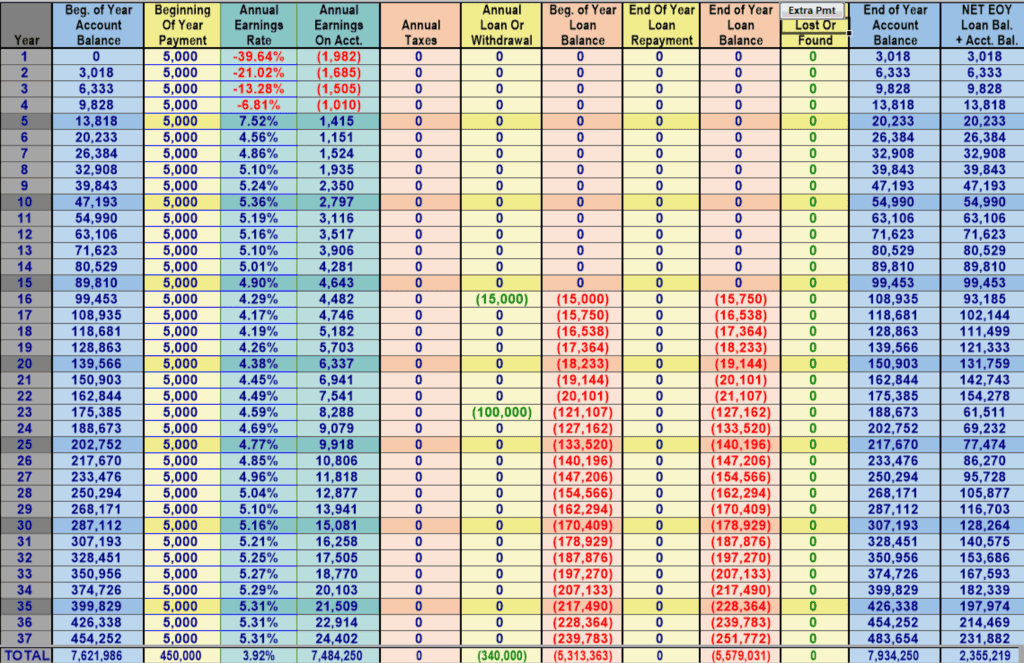
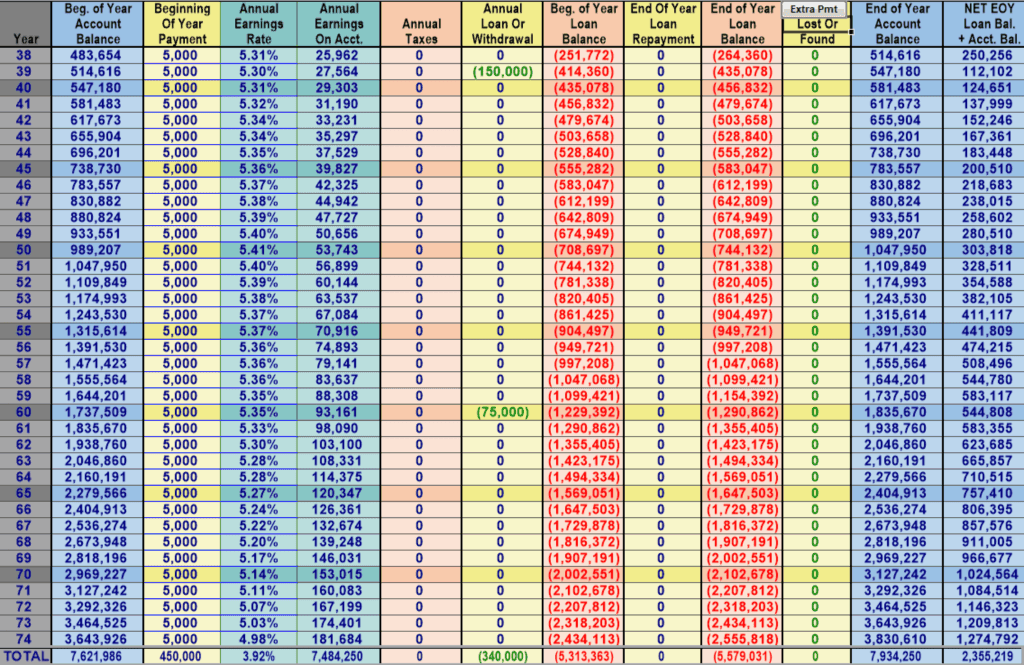
The difference between the two options in parenthesis. See above illustrations for year-to-year specifics.
Year 1: $3,018 (-$2,076 -40.7%)
Year 10: $54,990 (-$467 -.8%)
Year 25: $77,474 (+$40,692 +110.6%)
Year 40: $124,651 (+$144,705 +NA)
Year 65: $757,410 (+$712,893 +1,601.4%)
Year 90: $2,355,218 (+$2,123,813 +917.8%)
Here we still see that even if we failed to play honest banker and never paid the interest or principle back, we would still see a significant difference between the two savings options.
Savings with repayment
Ok, now, as promised, we will compare the HYS with additional payments back into savings to “pay back the previous spending”, and compare it to the WL with policy loan repayments from earlier.
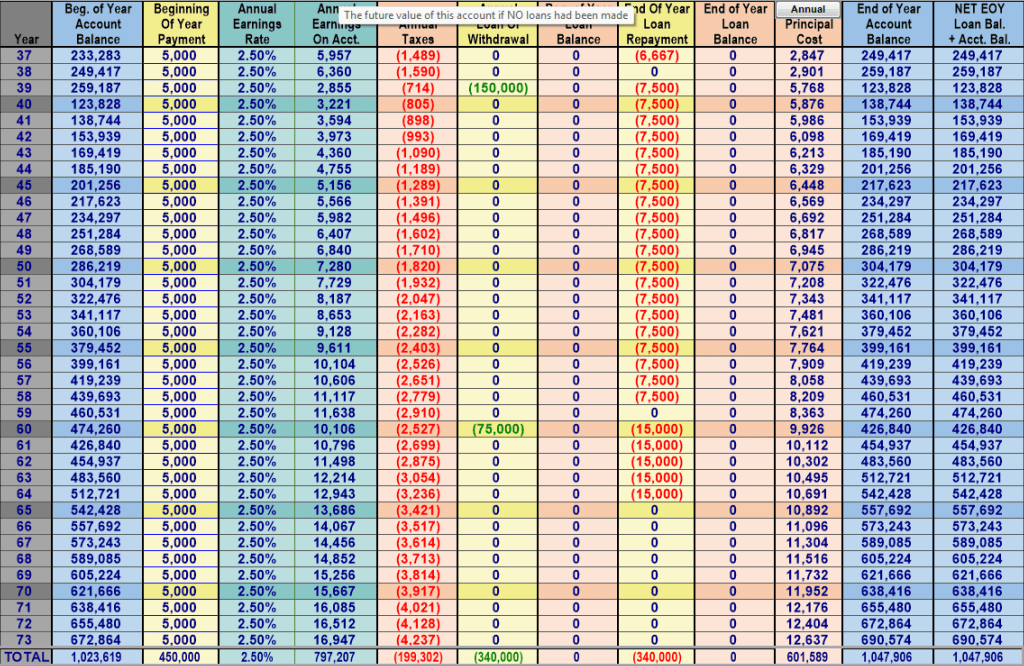
Difference between the two in parenthesis.
Year 1: $3,018 (-$2,076 -40.7%)
Year 10: $54,990 (-$467 -.8%)
Year 25: $74,248 (-$58,031 -43.9%)
Year 40: $138,744 (-$302,039 -68.5%)
Year 65: $557,692 (-$1,847,221 -76.8%)
Year 90: $1,047,906 (-$6,886,344 -86.8%)
Better, but still WAY off the alternative WL example. There is still a loss from Tax treatment, IRR, and though smaller than with no repayment, there is still an opportunity cost (OC) loss (it’s also important to note that a higher interest rate will mean a larger OC for the HYS option).
Conclusion
What I hope to have made clear here is that even if a HYS is a good option, and particularly in the short term, it does not come close to comparing over the medium or long term. But in addition to the significant difference in asset value, it is important to mention the other benefits you receive too.
With the WL policy you also receive a tax free Death Benefit; depending on the company, you can receive a Long Term Care and Critical Care rider that allows you to use the DB early for a LTC or Critical Care event; tax free income in retirement; better options in retirement, reducing risk and increasing efficiency of other assets; protection of the child’s insurability, in case something happened that prevented them from being able to purchase coverage later in life; asset protection (depends on state); and much more.
The biggest drawback, especially for policies on children, is the limit on premiums that can be paid into a policy. This is often capped by insurance companies and is usually based on some fraction of the total insurance owned by the highest insured parent. So, to put more than say $5,000 of premium into a children’s policy, a parent would likely need more than ~$2.5 million in total DB on themselves to get a policy large enough on their child to support the $5,000. Though, again, this varies among insurance companies.
If you are interested in learning more about this strategy, and whether it is right for you, you can reach out to work with me directly or find a Certified Practitioner in your area here.
Lastly, as I mentioned earlier, it is important to point out that this example applies equally even if instead of using your savings on consumption you used it to purchase investments, which is the better choice of what to do with your savings. Pretend those spending examples were on investment opportunities instead of consumption. In each case you would have the exact same investment asset, but now, having used IBC to fund said investment opportunity, you now have an additional asset that in retirement may be worth millions more than if you had used a traditional savings account to fund the same investments.
Life Insurance doesn’t make you rich, but it can make you richer than you otherwise would have been with no additional out of pocket expenses. It is simply a more efficient way to run your financial life, while also decreasing risk, and setting yourself up to protect your loved ones in a worst-case scenario.
No other option, available to the average person, compares.