There is a ton of confusion and misinformation out there about the stock market and what sort of returns you should expect, or that are realistic. So, I thought it might be helpful to go over some of these big misconceptions and help break them down and use real historical data to help clarify some of the confusions.
Before I start, note that the numbers I am using are historical returns, and one should not assume the future will be like the past. In fact, I would guarantee that it won’t, but it can still help us learn important ideas and principles and use those to look ahead.
So, you’ve probably heard many talking heads make claims that you should put your money in the stock market because history tells us you get a 12% rate of return. That’s huge! Your money would double every 6 years if this was the case.
Others give a bit of a lower expected return, claiming you will earn 10% per year, and other, more conservative types, will tell you to expect 8%.
But why the difference? They can’t all be right? Or maybe they are all wrong?
The truth is certainly more complicated, and in some ways, they are all correct, and in other, more meaningful ways, they are all wrong.
So, let’s dive in and look at the numbers.
First where does the 12% rate of return come from, that we often hear thrown around by people like Dave Ramsey?
If you looked at the average rate of return of the S&P 500 with dividends reinvested since its inception 95 years ago, it has seen an AVERAGE rate of return of 11.69%. Round up to 12% and that’s where the number comes from.
Ok, then where does the 10% number come from then? Well, if you took $1,000 and put it into the S&P 500 index with dividends reinvested, and let it ride, without ever putting another dime into it, you would have experienced a REAL return of 9.9% over those 95 years.
But wait, that doesn’t make sense. Didn’t I just say that it was a 12% rate of return over that 95 year period? Yes, and no. I said it was the AVERAGE rate of return, but the average rate of return is not the rate of return you actually earn. The 9.9% is the more accurate real rate of return in this instance.
Let me explain.
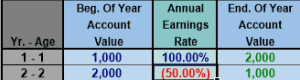
The average rate of return is simply a metric where you add up the annual returns and divide by the number of years. But this isn’t meaningful when it comes to actual experienced returns on your money. Here’s a visual as to why:
![]()
You see that in year one, this account earned a 100% return, and a -50% return in year two. The average rate of return of this account is accurately labeled as a 25% average rate of return. But at the end of year two you have the same $1,000 that you initially put in the account. So, your REAL rate of return, that is the return that you actually experienced, is 0%.
When we want to get a more accurate number of what our returns are, we need to know what the real return is and always ignore the average rate of return.
So then where does the 8% rate of return come from?
This one is a bit harder to figure out its origin, my guess is it really is just a more conservative and realistic return, so conservative people prefer to use this. But if you take the same 95 year track record of the S&P 500 Index with dividends reinvested, and you apply a 15% Long Term capital gain tax, then you end up with a 7.9% real return. Round up and you get 8%.
As you can see, all three numbers you might have heard from different talking heads, are “correct”, depending on how you’re thinking about the numbers.
But in reality, they are all wrong.
First, because it’s impossible to really know the returns one would have earned, or can be expected to earn, due to all sorts of important variables—some of which I will cover here shortly. But it’s also the case that they are all wrong because no one can know what the real return will be during the period of time you specifically are invested in the market. While the 95-year track record may be 8% after long term capital gain taxes, other 20, 30 and 40 year periods of the market have seen higher and lower real returns than this more reasonable 8% expected rate.
But even more importantly, these returns also fail to consider the full tax burden, management and trading fees (especially when in a 401k/IRA or in a mutual fund, where most people have their money). It also assumes you have a 100% allocation in equities (which almost no advisor would ever recommend*), assumes you’re 100% in the S&P 500 (90% of funds don’t even beat the S&P 500 benchmark, so a vast majority of people are likely not experiencing these expected returns I’m illustrating here), among other bad assumptions (people selling during a crash, buying at the top, dollar cost averaging vs non automated and regular contributions, etc.).
A More Accurate Look at Returns
So now what I want to do is take more of these variables into account.
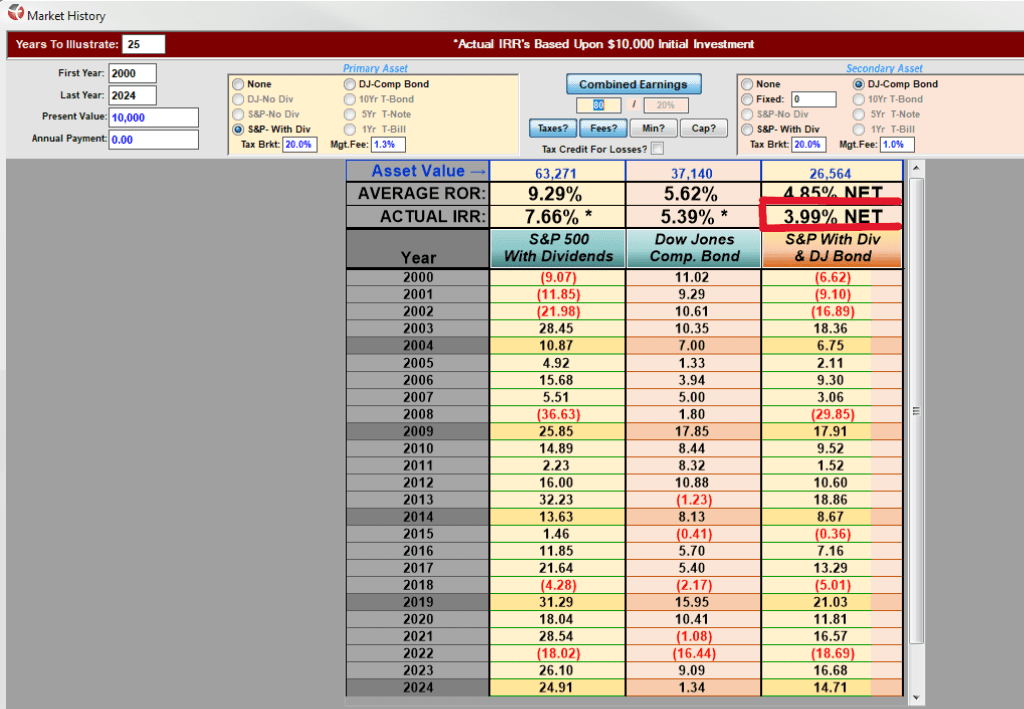
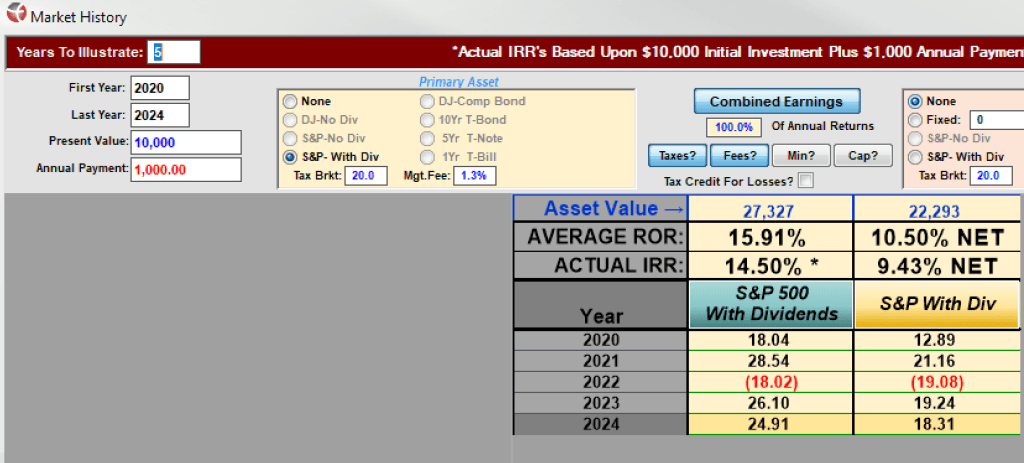
To start, I am going to look at the last 25 years of historical stock market returns. My assumptions in this first example are that we will allocate 100% of our original $10,000 investment into equities. We will assume a 20% tax bracket (assuming some gains to be long term capital gains and others to be dividend gains taxed at ordinary income, so this would be higher for people in a higher tax bracket, but I am attempting to be conservative here). I am also assuming a 1.3% advisor and management fee (the average for mutual funds and 401ks is 1.5%, since most people “invest” via a 401k, it’s important to note that the management fee is not the only fee you pay, there are advisor fees, trading fees and taxes and many others that are not often as visible).
So given these conservative assumptions, and assuming only a one-time investment of $10,000, you will note the following rates of return:
Average Rate of Return before taxes and fees: 9.29%
Actual Rate of Return before taxes and fees: 7.66%
Average Rate of Return after taxes and fees: 5.25%
Actual Rate of Return after taxes and fees: 3.94%
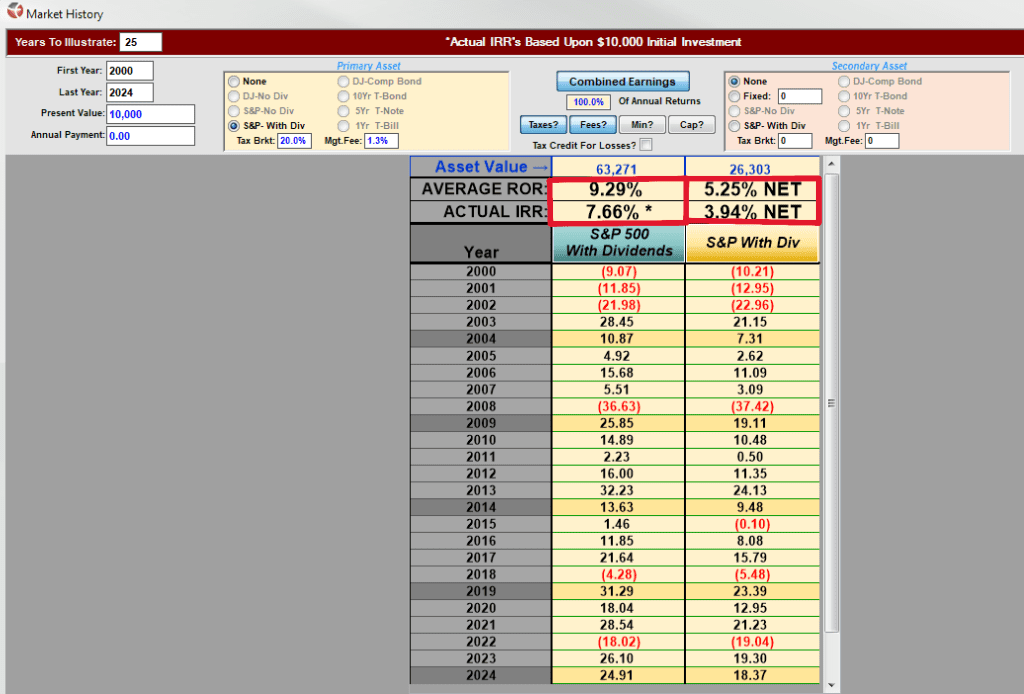
That is a HUGE difference. From an original claimed average rate of return of 9.29% down to a realized or actual rate of return of 3.94%, which also assumed you were not in the 90% of funds that under-performed the S&P 500, and also assumes you never sold during a downturn and bought at a peak (which many casual investors often do).
Instead of having the projected $63,271 after 25 years, instead you would have just $26,303 when you take more realistic assumptions into account.
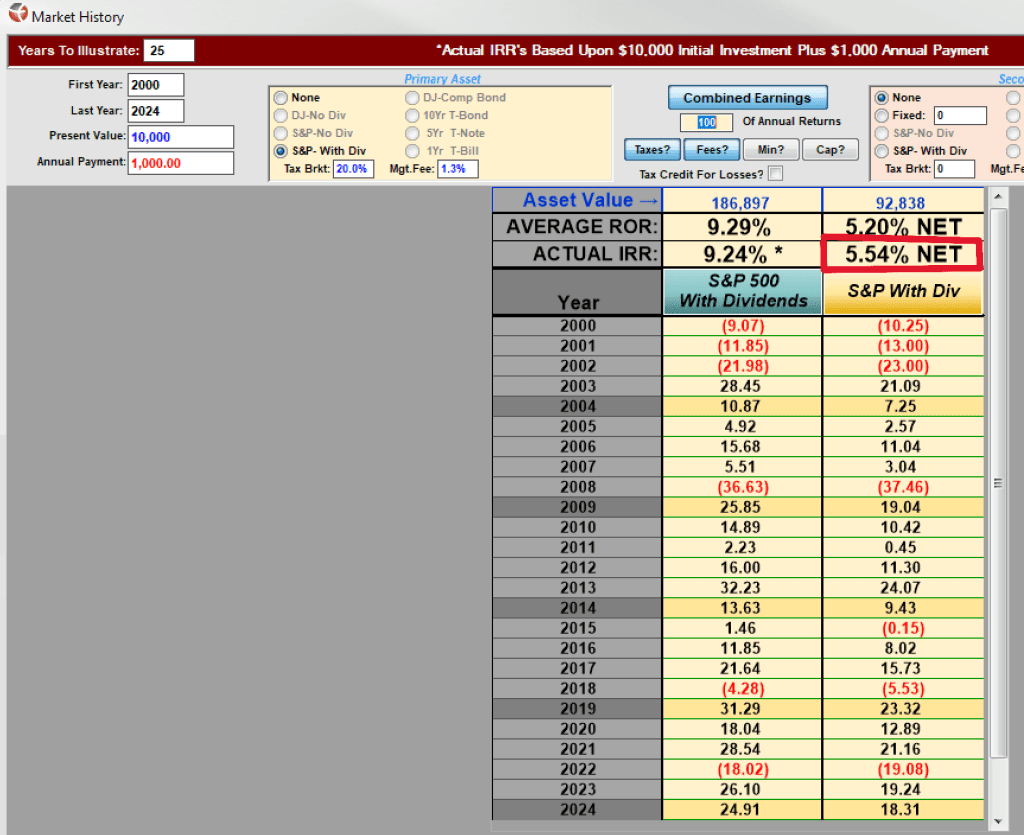
Now, what if instead of just a one-time initial deposit we also added $1,000 a year into the account and “dollar cost averaged”. Here we see this helps boost our returns by a whopping 1.6%. Showing the importance of regular automatic contributions, if you want to maximize your returns. Though it is still MUCH lower than the average rate of return often quoted by talking heads.
Now, just another caveat here. This is the last 25 years of returns, but most people didn’t start putting money into the stock market exactly 25 years ago. So, the actual returns you would have experienced will be very different for each person and when they start, when the end, and how much they put in along the way. The problem is we can’t know what those returns are going to be. There have been 25-year periods that were better and worse than this period.
80/20 Portfolio
Now, let’s look at an even more realistic option.
For this next example we are going to assume a more traditional portfolio model, where a portion of the portfolio is in bonds. Given that the software is limited, I will provide two examples, one in which you put money into the Dow Composite Corporate Bond Index Fund, and another where you bought 5 year T-Bills.
Assume an 80/20 portfolio, where 80% is in equities and 20% in Bonds, same tax rate and management fees as previously (except a lower mgt fee on the bonds), and we will assume this person keeps this ratio for 25 years (which isn’t realistic, but again, I am limited by the software).
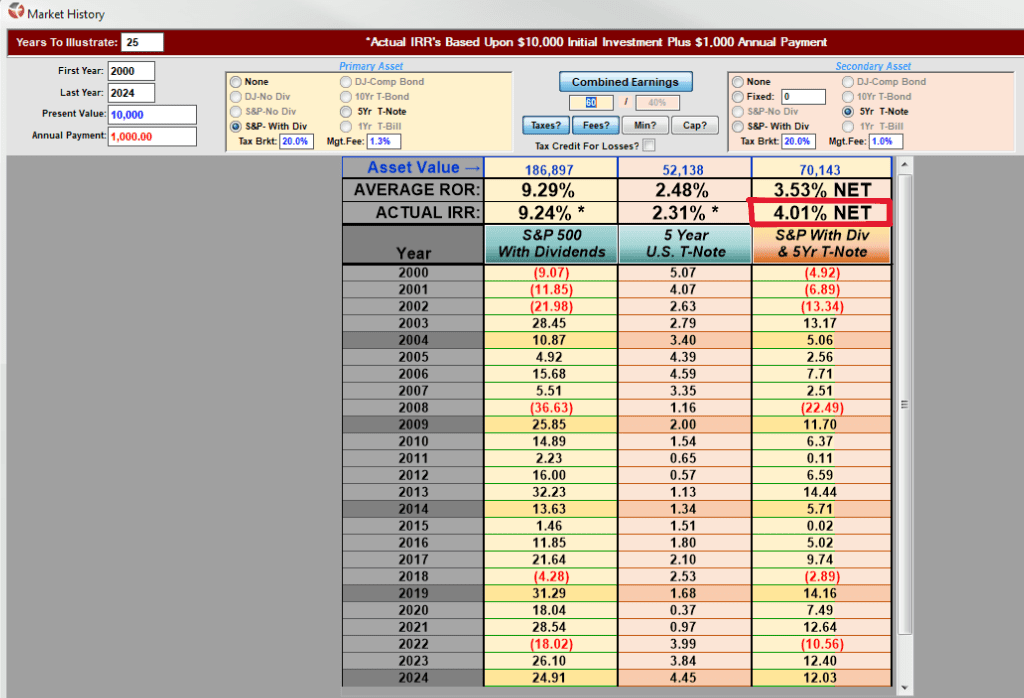
Four different examples will follow. Two with a single one-time deposit at the start of the 25 years, and then two (for each bond option), with ongoing “dollar cost averaging”.

You’ll notice here that by dollar cost averaging—meaning we are automatically investing $1,000 at the start of each year—that we were able to increase our actual net return by 1.13% to 5.12%. Again, showing the importance of regular automatic deposits without ever taking withdrawals.
Now the same, but with 5 yr T-Bills instead of the Dow Bond Index.


In both instances we see that the dollar cost averaging benefited our portfolio performance. We also see that in 3 out of 4 instances the 80/20 portfolio performed worse than the 100/0 portfolio. And in all cases, the actual experienced rate of return was FAR lower than the average rate of return. And most importantly, note the significant disparity when comparing the average rate of return with the actual rate of return with fees and taxes taken into consideration. These fees and taxes have significant drag on a portfolio. Often cutting your return by 40-60%.
60/40 Portfolio
Now let’s look at the same four examples but with a 60/40 split. This would be the type of portfolio a typical individual, with a normal risk profile in the later part of their career might be recommended. All other assumptions are the same as before.


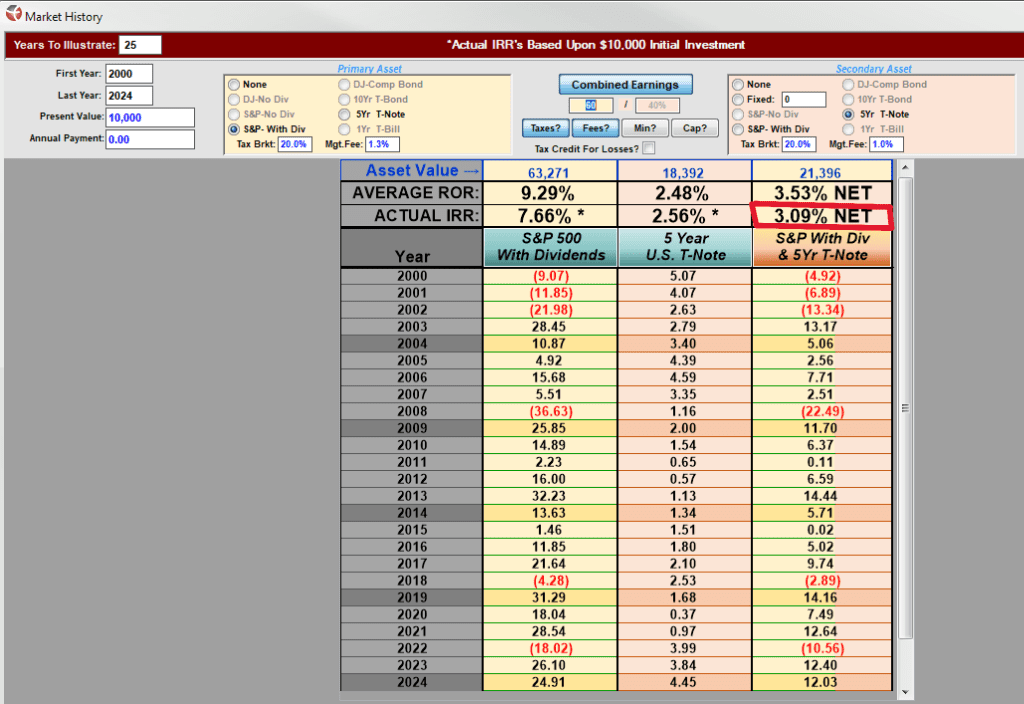
Here, when we do a traditional 60/40 portfolio design, it significantly under-performed the 80/20 and 100/0.
This isn’t meant to disparage 80/20 or 60/40 portfolio designs, in fact, there are many valid reasons for such a portfolio ratio, even despite the lower returns. For example, they help reduce volatility, and as you approach the distribution phase of your life, lower volatility is an important factor.
Rather, what I wanted to show here is that almost no talking head, or advisor, will recommend a 100/0 portfolio design, so when someone quotes to you that you can get a 12%, 10% or even 8% market return, while it is certainly possible, it is unlikely for all of the reasons mentioned above, but also because you likely won’t be in a 100/0 portfolio, but rather something more like an 80/20, 60/40, or even 30/70 as you get older.
For anyone in the market over the last 25 years, the actual returns that they would have experienced are more likely to have been between 3-5%. This is a far cry from the 12% people like Dave Ramsey throw around, or even the more conservative talking heads saying you can confidently earn 8%.
But, but, but….
Now, you may be yelling at me saying “but I am a better investor than the average, and my returns over the last 5 or 10 years have been 10% or more!” or something like that. And I get it, some people are able to get much better returns than the market, though they are rare. But also, the main reason you may be saying this is that you are relatively new to the stock market and have benefited from this:
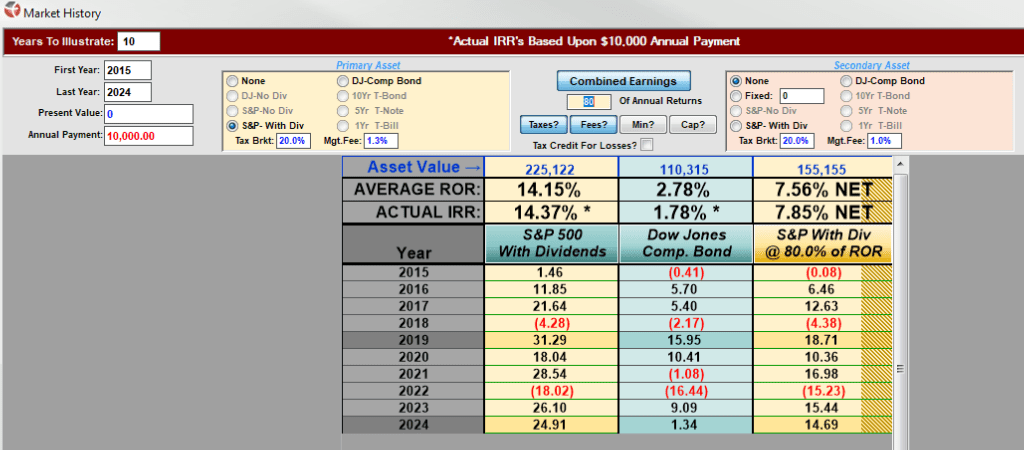
Or this:
What you would have experienced was one of the best 5 or 10 year periods in stock market history. And the question you would want to ask yourself is whether you think this will continue indefinitely, and whether your success is due to you as a great investor, or simply because there were large tail winds that inflated asset prices while you were heavy in the market? Do you think this is a realistic expectation going forward?
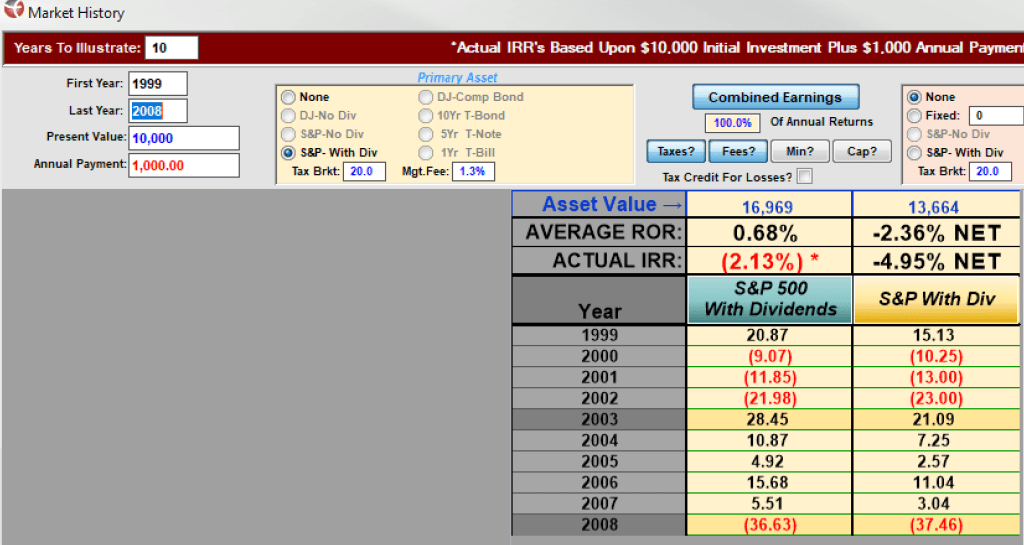
There have also been 10-year periods like this:
The point of this is simply to give some more realistic historical examples of actual realized returns, set better expectations, and open your eyes to consider alternatives to the stock market that you may not have considered. Or hopefully, at least, to help you understand how you might be able to make your stock market portfolio more efficient.
Regarding the latter, this might mean taking advantage of dollar cost averaging, it may also mean holding cash on the side to buy during dips, it may mean shifting the percentage of your portfolio that would normally be allocated to bonds into a better performing non-correlated asset like a high cash value whole life insurance policy (with a top mutual company and designed correctly), so that you can be 100/0 with your remaining portfolio assets, but get better returns with your conservative and lower volatility asset, which also has many other benefits (THIS book, and THIS book, will help explain this concept).
Regarding the former, it might mean looking at putting more of your assets in real assets with better tax advantages, like real estate. Or maybe getting into private lending. Or land flipping. Or other such non-traditional investment and business opportunities that have much higher upside, have collateral, and are less volatile.
The stock market isn’t as sure of a thing as many think, and often for many people, they only realize too late in their life that the returns they were promised don’t necessarily materialize when you consider all of the monetary leaks and realities that are often overlooked, ignored, or minimized.
A 4% or 5% return is a big difference when you were promised 12%. Don’t wait until it’s too late to do something about it.
*Standard advice is to have a balanced portfolio between stocks and bonds by taking 100 and subtracting your age to determine your appropriate stock to bond ratio. So, if you were 50 years old, you would want a 50/50 portfolio allocation between the two.
Wonderful article. I think this should be required reading in schools and really by anyone who is even thinking of putting their money in a 401k.
One item to consider adding to your article: 401k Match. Please explain how that often, like a siren’s song, often comes with golden handcuffs